
The Blogosphere Ecosystem Part II: A Pretty Picture
OK, I alluded to a Part II coming today, and sure enough, here it is.
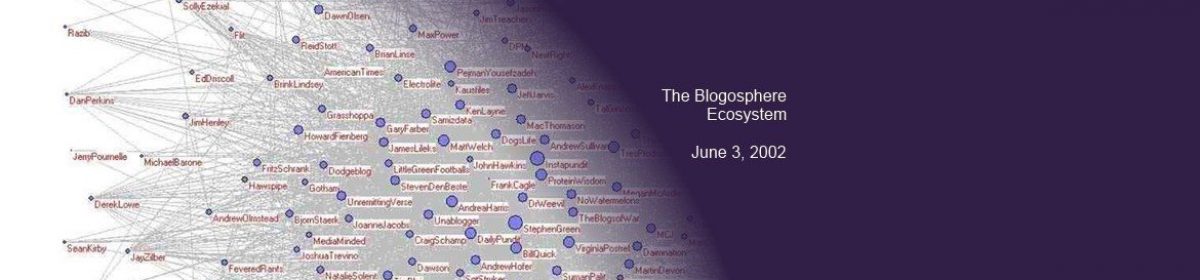
The picture to the right is a smaller version of a of the blogosphere that I’ve created based on the linkages which I previously analyzed to produce the ranked list. Click on the link above to see the full-sized version.
The map is a graphical representation of the relationships between weblogs in the Blogosphere; each weblog is represented by a node, with links between weblogs shown as lines. The size of a node roughly corresponds to how connected it is to the other nodes in the blogosphere.
It also uses the same data set that was used to produce the Blogosphere Ecosystem list. The full list of tools to perform all this magic is as follows:
WinHTTrack Website Copier
Spadix Software‘s Extract Link
Microsoft Excel
Pajek, a program for large network analysis & graphing from Vladimir Batagelj and Andrej Mrvar at the University of Ljubljana.
I may keep playing around to see if I can generate an even-more readable version of the graph; there’s lots of fun options to tweak in the Pajek drawing program (Pajek, by the way, is the Slovene word for “spider”. So don’t go saying you never learn anything from reading my page, eh?)
Also: I’m a bit bandwidth-constrained right now, so even the big version of the map is very compressed. If anybody with a lot of bandwidth to burn wants to volunteer a spot to stick a higher-quality version, let me know, and I’ll send it to you.
Enjoy…